
I need to make better hiring decisions
Recruitment
Globally, companies are shifting toward data-driven hiring, but most tools still miss a critical factor: Can this person function in English in a real work environment?
Get in touch
🇿🇦 South African
Reality
In South Africa, this is amplified. Candidates may appear confident in conversation, but struggle with instructions, comprehension, and written communication.
As a result, you are not selecting for potential — you are selecting based on incomplete information. Many candidates meet formal requirements but struggle to apply them in real work environments.
The real hiring risk is often invisible at interview stage
Our Insight
From 14 years of data
Social VS Workplace English
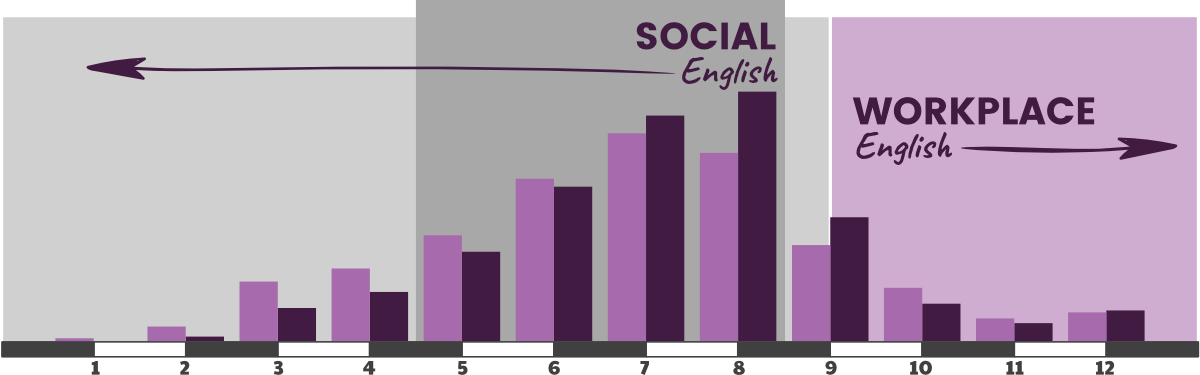
How the scale works
Language develops along a spectrum of 12 formal milestones — one for each year of schooling. Each milestone reflects the outcomes expected of a native speaker at that stage.
What the data shows
Across 16 725 candidates over 7 years, the average South African employee is comfortable at level 8 (dark purple).
Level 8 marks the ceiling of social English. Despite measurable improvement over the previous period (pink), the jump to workplace-level proficiency — level 9 and above — remains out of reach for most candidates.
Why this matters for hiring
Interviews happen in conversation. Workplace performance happens in writing, reading, and reasoning. Most hiring processes never test the gap between the two.
Impact
& Losses
In high-volume environments, this becomes a systemic cost problem
The real cost of a poor-fit hire
Smart selection costs thousands. A poor-fit employee costs hundreds of thousands — mostly through invisible operational friction. Adjust the sliders to model your organisation’s scenario.
Your hiring scenario
Cost breakdown
Poor-fit hires / year
8
Annual mismatch loss
R1,200,000
Assessment investment
R20,000
Estimated annual saving
R600,000
For every rand spent on assessment, you potentially save 30× in avoided mismatch costs.
Figures are illustrative estimates based on your inputs. Actual results will vary by organisation and role type.
The Solution Pathway
We interview candidates who seem fine, but once they start working, they struggle.
Match candidates to role requirements
We need to screen large volumes quickly
Screen efficiently at scale
Smarter hiring starts here
Get a clearer picture of your candidate risk before you hire
Tell us what matters most to you
Explore a different pathway
Workplace Communication
Strengthen communication where it matters most →
Workforce Insight
Turn workforce data into practical decisions. →
Reduce Training Failure
Measure readiness before learning begins →
Workforce Development
Build English capability for workplace success. →
Future Readiness
Develop the human capabilities needed for the future of work. →